Debugger improvements in GPS 17
by Emmanuel Briot –
The GNAT Programming Studio started as a tool named GVD (graphical visual debugger), which was just a GUI for the gdb command line debugger. Editors were showing the code, but not allowing editing.
Of course, it then evolved (a lot) and became a full fledged integrated environment. But support for debugging activities is still a very important part of the experience. We had accumulated a number of enhancement requests, which have finally been implemented in this year's release.
Here is a quick summary.
Set breakpoints at any time
Historically, users had to initialize the debugger (i.e. enter a special mode in GPS) before they could start setting breakpoints. That's because breakpoints were only managed by the debugger itself.
In practice though, it is generally when you are reading code that you decide that a breakpoint might be a good idea. Having to start the debugger first breaks the flow of ideas.
So it is now possible to set a breakpoint at any time in GPS, whether the debugger is running or not. To do this, simply click on the line number. GPS will display it with a blue background (and show a tooltip if you hover to explain what the color means). In the following example, we have clicked on line 42.
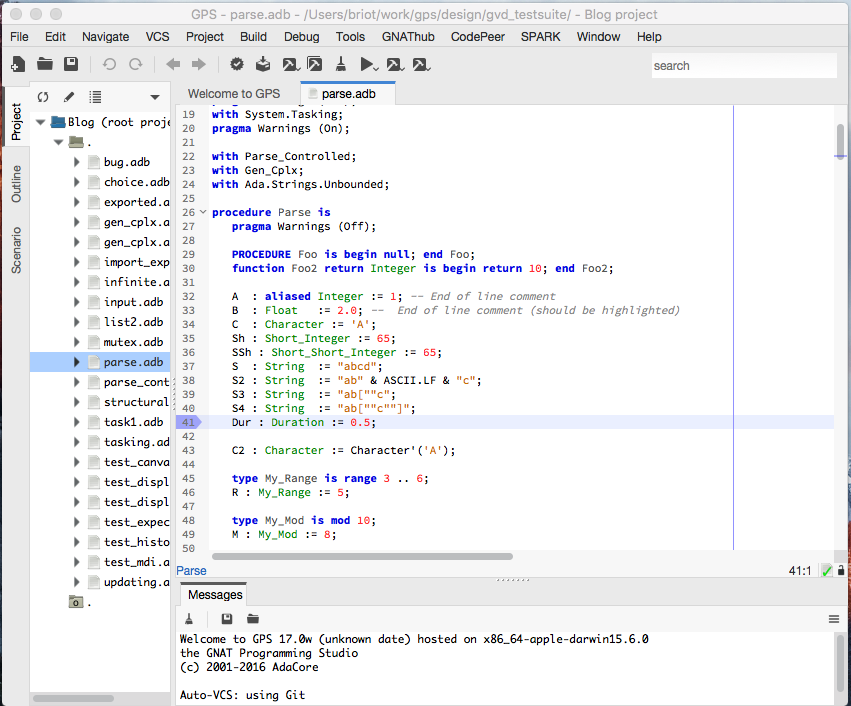
In previous versions, GPS was displaying small grey or red dots next to lines with executable code, and you had to click on those points to set the breakpoints. We have now removed the display of these dots for several reasons: they were computed via relatively expensive calls to the debugger (and thus required that a debugger be running), they were imprecise, depending on the optimization level used to compile the code, and were taking valuable screen-estate.
New debugger perspective
Let's now start the debugger. This is done, as before, by selecting the menu /Debug/Initialize/ and the executable to run. This step is still necessary to let GPS know that the debugger should be started, and that you might want to do additional setup before actually running the debugger (like connecting to a board, attaching to a running process,...) We are working on simplifying that step as well, although this will not be part of the release this year.
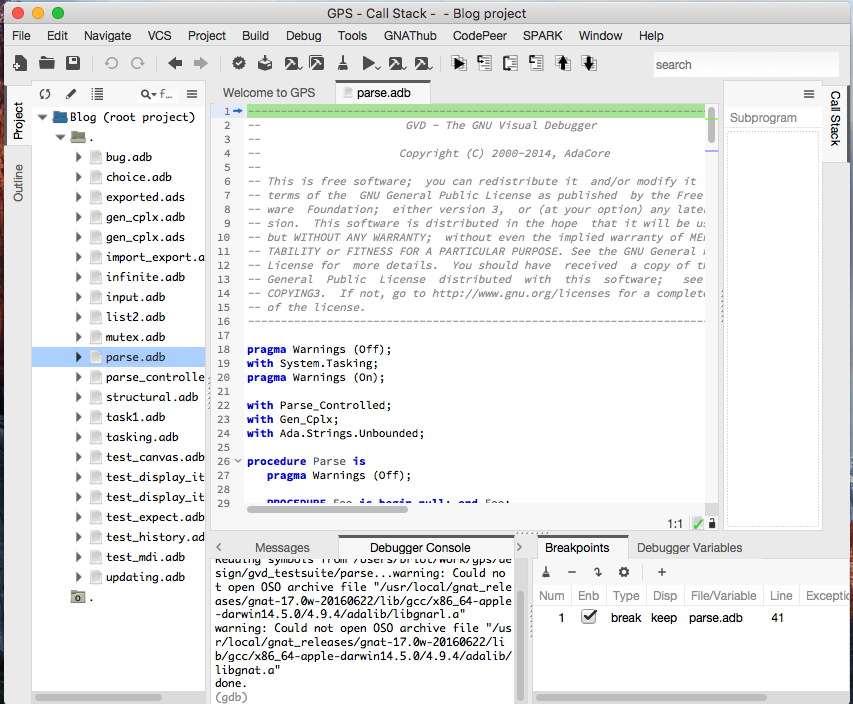
If you look at the screenshot, you might notice that the layout of the window (what GPS calls the Perspective) is different. Although, if you have used GPS before, you will not see the same view, since GPS always tries to restore what you had setup previously. The solution, currently, is to remove the file perspectives6.xml in HOME/.gps/ or %USER_PROFILE%\.gps depending on your platform and then restart GPS.
Here are the changes we have done:
- Removed the Data window, which was used to display the variables as boxes in a graphical browser. This view is still available, but has been replaced in the default perspective by the Debugger Variables view (see below)
- Display the Breakpoints view by default
These are small changes, but might bring attention to some of the view we think are very useful when debugging.
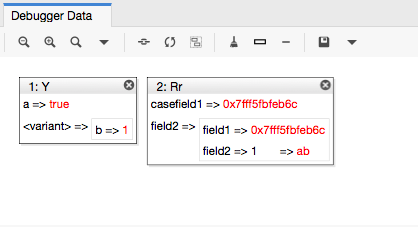
The Debugger Variables view
A new view has been added to display the value of variables as a tree. It comes in addition to the existing Debugger Data. Here are two screenshots showing the same information in both views.
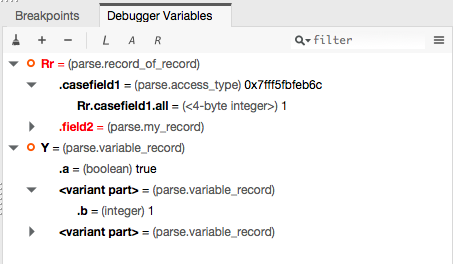
To display information in the Debugger Variables, the simplest is to right-click on the variable in the source editor, then select the Debug/Tree Display contextual menu. This will add the variable to the list of those displayed. You can then expand fields as you want by clicking on the arrows.
When the variable is an access (or a pointer), expand its value will show the value it points to.
If you look at the buttons in the toolbar of the Debugger Variables, you will find some that enable you to display the value of any expression (the + button), or the list of all local variables for the current subprogram, or the value of the CPU registers.
Breakpoints view
We have redone the Breakpoints view, which displays the list of breakpoints. It used to be a very large window but we have now simplified it significantly so that it can be kept visible at all times. And since breakpoints can indeed be set anytime, as we mentioned before, you can also display the Breakpoint view when the debugger has not been started.
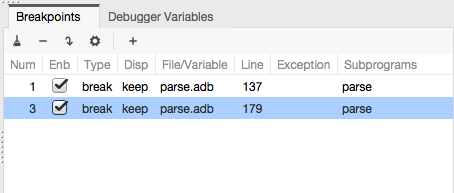
The view lists each known breakpoint, with its location. You can simply double-click on any of the breakpoints to open a source editor showing its location.
By unselecting the check box, the breakpoint will be disabled, and gdb will no longer stop at that location.
If you press the mouse for a short while on the breakpoint (or alternatively click on the gears icon in the toolbar), GPS opens a new dialog that lets you edit some advanced properties of the breakpoint, like the conditions that should be met for the debugger to stop, or how many times the debugger should ignore this breakpoint before it actually stops.

Performance
In the default debug perspective, GPS always displays the Call Stack window which shows, whenever the debugger stops, the current subprogram and where it was called from. This information is of course queried from gdb itself, and depending on the settings it might take a while to compute. For instance, displaying the value of the parameters can sometimes take a few seconds for large callstacks on some systems. This leads to very long delays whenever the debugger stops.
We have optimized things a bit here. If the Call Stack is not configured to show the value of the parameters, then GPS makes sure that gdb doesn't spend any time computing it.
Scripting
Like all parts of GPS, the debugger can be fully controlled via python scripts. This lets you run your own commands whenever the debugger stops for instance, or automatically display the value of some variables, or anything else you could imagine in your context.
In this release, we have added a number of new python commands to make interfacing simpler. For instance, there is now a value_of function to query the value of a variable (while cleaning up extra information output by gdb), or a breakpoints command to efficiently retrieve the current list of breakpoints (and benefit from GPS's own cache)
About Emmanuel Briot

Emmanuel Briot has been with AdaCore between 1998 and 2017. He has been involved in a variety of projects, in particular oriented towards graphical user interfaces, including GtkAda, GPS, XML/Ada, GnatTracker and our internal CRM. He holds an engineering degree from the Ecole Nationale des Telecommunications (Brest, France).