
Time travel debugging in GNAT Studio with GDB and RR
by Ghjuvan Lacambre –
Introduction #
Traditional debugging tools usually let you place breakpoints and follow the program’s flow. You can see the evolution of the program’s state, but if you want to know how the program arrived to a certain state, you have to add logging facilities to your program in order to be able to retrace state’s history. The “reach a certain point in the program -> discover that a variable doesn’t have the right value -> add logging to figure out what changed it -> launch the program again” cycle can be a very time consuming process which can be made even slower by non-deterministic, hard to reproduce bugs. Note that time travel debugging is usually very os-dependent and that the two tools described here are linux-only.
Time travel with GDB #
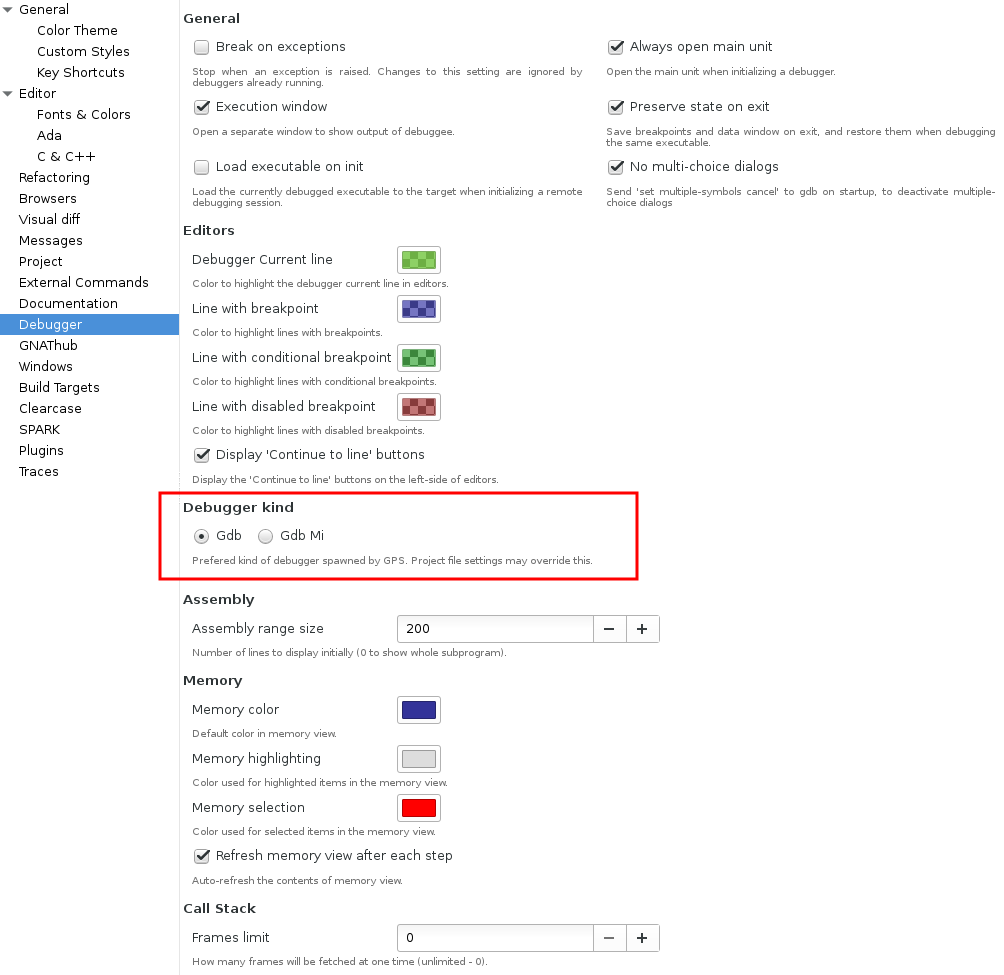
One solution to this problem is time travel debugging. GDB implements time travel debugging with its record command. To use it in GNAT Studio, one just needs to make sure that GDB is used rather than GDB mi in GNAT Studio’s preferences (Edit > Preferences > Debugger), as shown in the screenshot below.
Then, after building the project in debug mode, and starting it with the ‘start’ command, GDB’s ‘record full’ command will start the recording of the program’s execution. Breakpoints can be then placed in points of interest and, when going back is time is needed, the ‘reverse-next’, ‘reverse-step’ and ‘reverse-finish’ commands can be used.
GDB’s record and replay functions are extremely useful: they support a wide variety of architectures and allow recording only parts of a program’s execution. They have downsides though: sometimes the buffer used for recording execution will get full and you’ll have to discard your record history. You can only record execution from GDB, they make execution slower and do not work with programs that use AVX/SSE instructions.
Time travel with RR #
If the architecture you’re targeting is x86_64, there is a solution to the above problems: RR. RR (which stands for Record & Replay) is a tool developped by Mozilla to help with debugging Firefox. RR records a whole program’s execution, from start to finish and lets you replay it as many times as you want, even across different GDB sessions. It does make program execution slower, but not as much as GDB’s record and replay feature.
In order to use RR from GNAT Studio, first install RR (installation instructions are available at the bottom of the RR website). Once this is done, make sure that the setting that controls the granularity of perf event reporting in your kernel is set to 1 (this can be done by cat
/proc/sys/kernel/perf_event_paranoid' and setting it to 1 is as simple as 'echo
1 | sudo tee /proc/sys/kernel/perf_event_paranoid). Just like with time travel with GDB, make sure that you are using ‘gdb’ and not ‘gdb mi’ in your GNAT Studio debugging preferences.
Here’s a mini-tutorial that shows how to use RR with GNAT Studio. In order to follow along, create a new “Simple Ada Project” in GNAT Studio. Set the content of ‘src/main.adb’ to the following:
with Ada.Numerics.Discrete_Random;

procedure Main is

   package Rand_Positive is new Ada.Numerics.Discrete_Random(Positive);
   Generator : Rand_Positive.Generator;

   Error : exception;

   Bug : Boolean := False;

   procedure Make_Bug is
   begin
      Bug := True;
   end Make_Bug;

   procedure Do_Bug is
   begin
      Bug := True;
   end Do_Bug;

begin
   Rand_Positive.Reset(Generator);

   for I in 1..10 loop
      if Rand_Positive.Random(Generator) < (Positive'Last / 100) then
         if Rand_Positive.Random(Generator) < (Positive'Last / 2) then
            Make_Bug;
         else
            Do_Bug;
         end if;
      end if;
   end loop;

   if Bug then
      raise Error;
   end if;

end Main;
This program has a 10% chance of crashing, so we will first need to record a crashing run. To do that, compile the project in debug mode (‘View > Scenario’ , set ‘Build Mode’ to ‘debug’ and then press ‘<F4>’). This will produce a binary in your project’s ‘obj/debug’ directory. Navigate to this directory in a shell and try to record the program’s execution with RR with the following command: ‘rr record ./main’. You can then run ‘rr replay’ to have RR start GDB for you (but don’t do this — we’ll use GNAT Studio instead!).
You might have been lucky enough to get a crash on your first recording, but if that is not the case, recording executions until you do get a crash is easy: when they raise an exception that isn’t caught, Ada programs exit with a non-zero exit code. We can use this to have the shell record executions until we do get a failure, like this: ‘while rr record ./main ; do true ; done’.
Now that we have recorded a crash, we could debug it in GDB from our shell (with ‘rr replay’), or from GNAT Studio. We’ll try GNAT Studio.
In your shell, run ‘rr replay -s 12345 &’. RR will print a message telling you to run GDB, which you shouldn’t do (because we’ll use a GDB process started by GNAT Studio). Copy the path printed at the end of the GDB command to your clipboard. In GNAT Studio, start the debugger (‘Debug > Initialize > Main’). You should get a GDB window at the bottom of your screen. In that window, run the following commands:
set sysroot /
target extended-remote 127.0.0.1:12345
file PATH_YOU_COPIED_FROM_THE_SHELL
GNAT Studio’s debugger should now be connected to RR. This means that all GDB for time travel (reverse-next, reverse-step, reverse-finish…) are available to us. Since we know the error happens on line 36, we can just put a breakpoint there: either click on line 36 in the number column or type ‘break main.adb:36’ in GNAT Studio’s GDB window. We can execute the program until we reach that breakpoint with ‘continue’, by pressing ‘<F8>’ or by clicking on the “play” button at the top of GNAT Studio. ‘print Bug’ (or hovering the mouse over the variable) shows that the program reached this line because the variable named ‘Bug’ is set to true. But what procedure set ‘Bug”s value to true? Right clicking on ‘Bug’ and selecting ‘Debug > Set watchpoint on Bug’ (or running ‘watch Bug’ in the GDB window) and typing ‘reverse-continue’ in the GDB window will tell us that it happened either in ‘Make_Bug’ or ‘Do_Bug’.
This is a very simple example, but it hopefully shows how useful RR can be and how simple it is to use it from GNAT Studio!